This construction video tutorial will introduce you to the stress and strain curve/diagram for steel structures.
Definition of stress
When an applied force creates alteration in the dimension of the material, then the material is supposed to be in the state of stress. The stress can be detected by dividing the applied force (F) by the cross sectional area (A).
When an applied force creates alteration in the dimension of the material, then the material is supposed to be in the state of stress. The stress can be detected by dividing the applied force (F) by the cross sectional area (A).
Definition of strain
When the dimension is altered in regard to the original dimension because of stress, it is called as strain. It is described with the symbol epsilon.
ε = x/ L
For a shear force, strain is stated with γ (gamma)
ε = x/ L
For a shear force, strain is stated with γ (gamma)
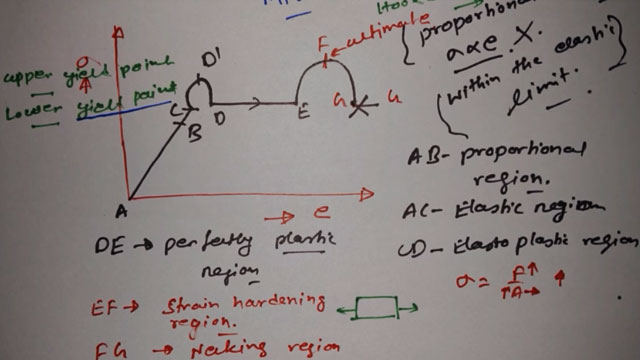
Stress strain curve belongs to a behavior of material when it has to withstand load. If a ductile material like mild steel has to pass through the tensile test, then it moves through different phases prior to fracture.
These phases are given below :-
1. Proportional Limit
2. Elastic Limit
3. Yield Point
4. Ultimate Stress Point
5. Breaking Point
1. Proportional Limit
2. Elastic Limit
3. Yield Point
4. Ultimate Stress Point
5. Breaking Point
The stress-strain diagram varies in form for different materials.
To acquire stress-strain diagrams, a graph or curve is drawn from the data that has been found in a tensile test. The modifications occurred in length can be detected and recorded through various strain measuring devices.
Published By
Rajib Dey
www.constructioncost.co
~~~~~~~~~~~~~~~~~~~~~
No comments:
Post a Comment